Visualization Project
Digital Services Dashboard
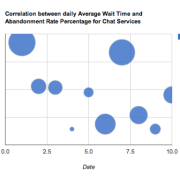
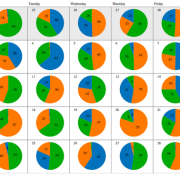
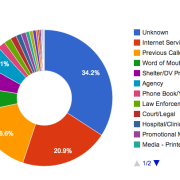
This project focused on developing useful visualizations based on call and chat center data from the National Domestic Violence Hotline (NDVH). Initially, the project focused on phone and chat intake data. However, upon examination, the focus was narrowed to exclusively examine the chat system data.
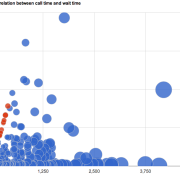
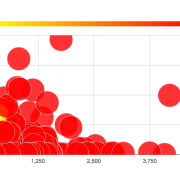
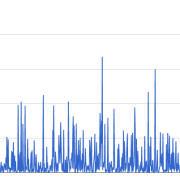
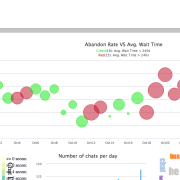
The final project concept was to design and create visualizations of these data sets in a way that provides insights into factors contributing to denied services, referred to internally as “Abandonment Rates.” While the hotline fielded more than 331,078 contacts last year, another 70,000 attempts to contact the hotline went unanswered. In this project, we hoped to illustrate key relationships and patterns within the data that could help hotline staff anticipate spikes in service requests. This would enable management to make more informed staffing decisions in order to reduce denied services and lower abandonment rates.


